 |
| Daily charts of March, May, July, and December 2014 Soybean Oil Futures |
Generally, a 20+% movement would define the beginning of a bull market. In hindsight, it appears that enough large traders used the weekly 61.8% retrace to turn the trend. Of course, market economics such as grain and crush worldwide supply and demand should influence the futures price, but in the absence of such facts, traders will trade and we saw that Fibonacci ratios appear to be the methodology used by those traders large enough to change the daily/weekly trend.
What's done is done, so where does soybean oil go from here? Let's delve into some weekly statistics to get a sense of the "uniqueness" of this recent upward movement.
The week ending March 14, 2013 was the first down week since the January 2014 weekly low. This down week, was preceded by six positive weeks.
- Since January 2001, there have been only four runs of seven or more positive weeks, with the maximum positive streak at nine weeks.
- There have been four stretches of six positive weeks (including 2014's bounce).
- In total, since January 2001, there have been eight instances of six or more positive weeks in a row.
So a move of this duration is unique and this bull market was due for a rest. Was last week that rest? In no instance did a run of 6+ up weeks define a meaningful swing high in price - in all instances the following weeks were defined by a period of market consolidation (both up and down weeks). In six of the seven previous streaks, price was higher 10 weeks later. To summarize, the upward pause is not unexpected.
Let's take a look at the daily, continuous Soybean Oil chart to attempt to explain the recent swing high:
 |
| Daily, Continuous Soybean Oil Futures |
The green Fibonacci retrace shows the key prices on the return to the highest price set in the last three years, set on April 11, 2011. Price has not yet approached the lowest retrace (38.2%) so this swing range is not yet relevant.
The orange Fibonacci retrace shows the key prices on the return to the recent high set on September 4, 2012. You can see that last week's high was a 38.2% retrace from the swing high labelled as point 2. 38.2% retraces, if they hold, are considered momentum continuation. Since the trend from point 2 is down, you might expect prices to continue down.
Also on the chart is a grey horizontal box, that represents an area that support/resistance or supply/demand traders may consider appropriate for a short, the August 26, 2013 was a very visible swing high.
Two different trading styles aligned at a very similar prices. Once again, this change in price direction/pause is not unexpected. Let's zoom into the daily continuous chart from August 2013 to today to analyze the Fibonacci patterns:
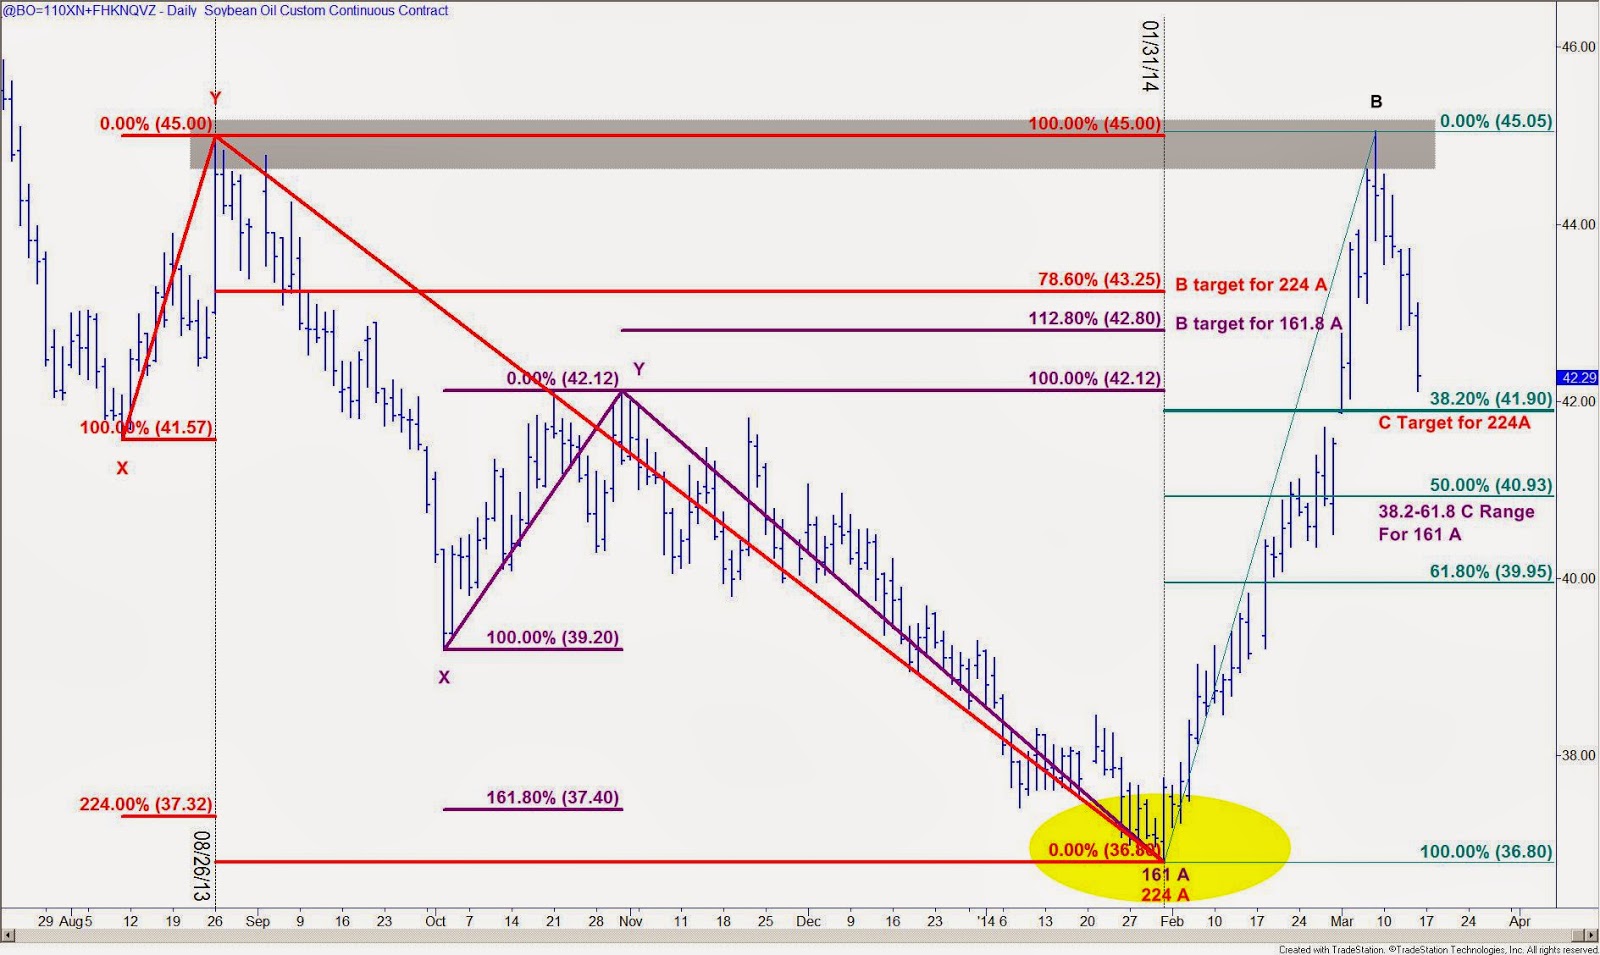 |
| Daily, Continuous Soybean Oil Since August 2013 |
There are two meaningful price swings, one defined by the red Fibonacci tool and one defined by the purple Fibonacci tool. Depending upon which swing you select, the low at 36.80 is either a 161.8A "inverse head and shoulders pattern" or a 224A "V pattern." In both cases the target for "B" is marked on the chart, the recent swing high exceeds both these points so we can consider the high at 45.05 to be the "B" point for either structure. If the low is a 161A then we would expect price to retrace to the 38.2-61.8% area to set the C point at which point price will turn back up. If the low is a 224A then we would expect price to only go to the 38.2% price to set the C point and then turn back up.
One complexity with agricultural futures is that several different contracts trade simultaneously. The first chart in this post shows that March, May, June, and December 2014 contracts are trading and each set its swing low on the same day, but at a different price. The most recent two daily charts in this post used the "continuous" chart which represents the price of the front month. Since March was the front month for the low on January 31 and May the front month for the recent high, the continuous charts generate different C points than a chart using only the May contract. The following daily chart is the May 2014 Soybean Oil futures contract:
 |
| Daily, May 2014 Soybean Oil Since August 2013 |
There are meaningful differences on this May 2014 contract chart. First, the price of the X, Y, and A points differ so the low becomes a 261.8A "V pattern" or a 200A "inverse head & shoulders pattern." The difference in X, Y, and A generate different targets for B, C, and the pattern destination too. I have left off the destination, but for each pattern, the destination is the 161.8 - 224% extension of the XY leg.
Clearly, if price breaks 40.16 (the lowest C target) then the bull is dead and the recent high was the 38.2% momentum continuation. If the C area holds then be prepared for more upside in Soybean Oil.
Aside from the 38.2% retrace on the daily continuous and the duration of the bounce, were there any hints that price might stop where it did? Of course there were. Let's review the 60 minute May 2014 contract:
 |
| 60 Minute, May 2014 Soybean Oil Contract |
As you can see, there was a textbook 224A "V pattern" short on the sixty minute chart. This "smaller" time frame "A" short, aligned with the 38.2% retrace on the daily chart. Notice that the 78.6B, 50C and pattern destination were all achieved. Based on the daily chart, the 38.2C at 42.03 is a confluence price area. Only time will tell which way soybean oil will go. Some traders are long, some are short and many are on the sidelines. As for me ...

See the trade. Take the trade.